- Home
- Leiter: Prof. Dr. Rudolf Kruse
- Mitarbeiter
- Lehre
- Forschung
- Publikations- datenbank
- Kontakt/Anreise
News-Archiv
Confidence Interval Visualization
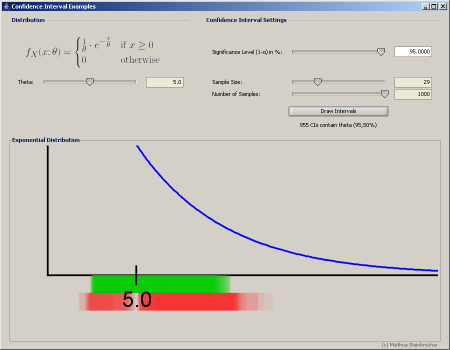
The program visualizes the intention behind confidence intervals exemplified with an exponential distribution. Start the program an choose a specific density by setting a respective parameter value for theta.
The simulation draws samples of fixed size (both numbers can be set on the upper right side). For every sample that was drawn a confidence interval for theta is computed and checked whether the true (but in real applications unknown) parameter lies within the interval. If so, the interval is painted as a green rectangle. If the true parameter is not contained the interval is painted in red. Every interval is painted with some degree of transparency to illustrate where the core regions of the intervals are located.
Check out what happens if you change the sample size or the significance level or both.

